

Tools for daily work
Applications your clinicians open every day.
Ready-to-use tools on top of the data foundation, configured with each department. All of them run on the same data your IT and your other applications use.
Studio
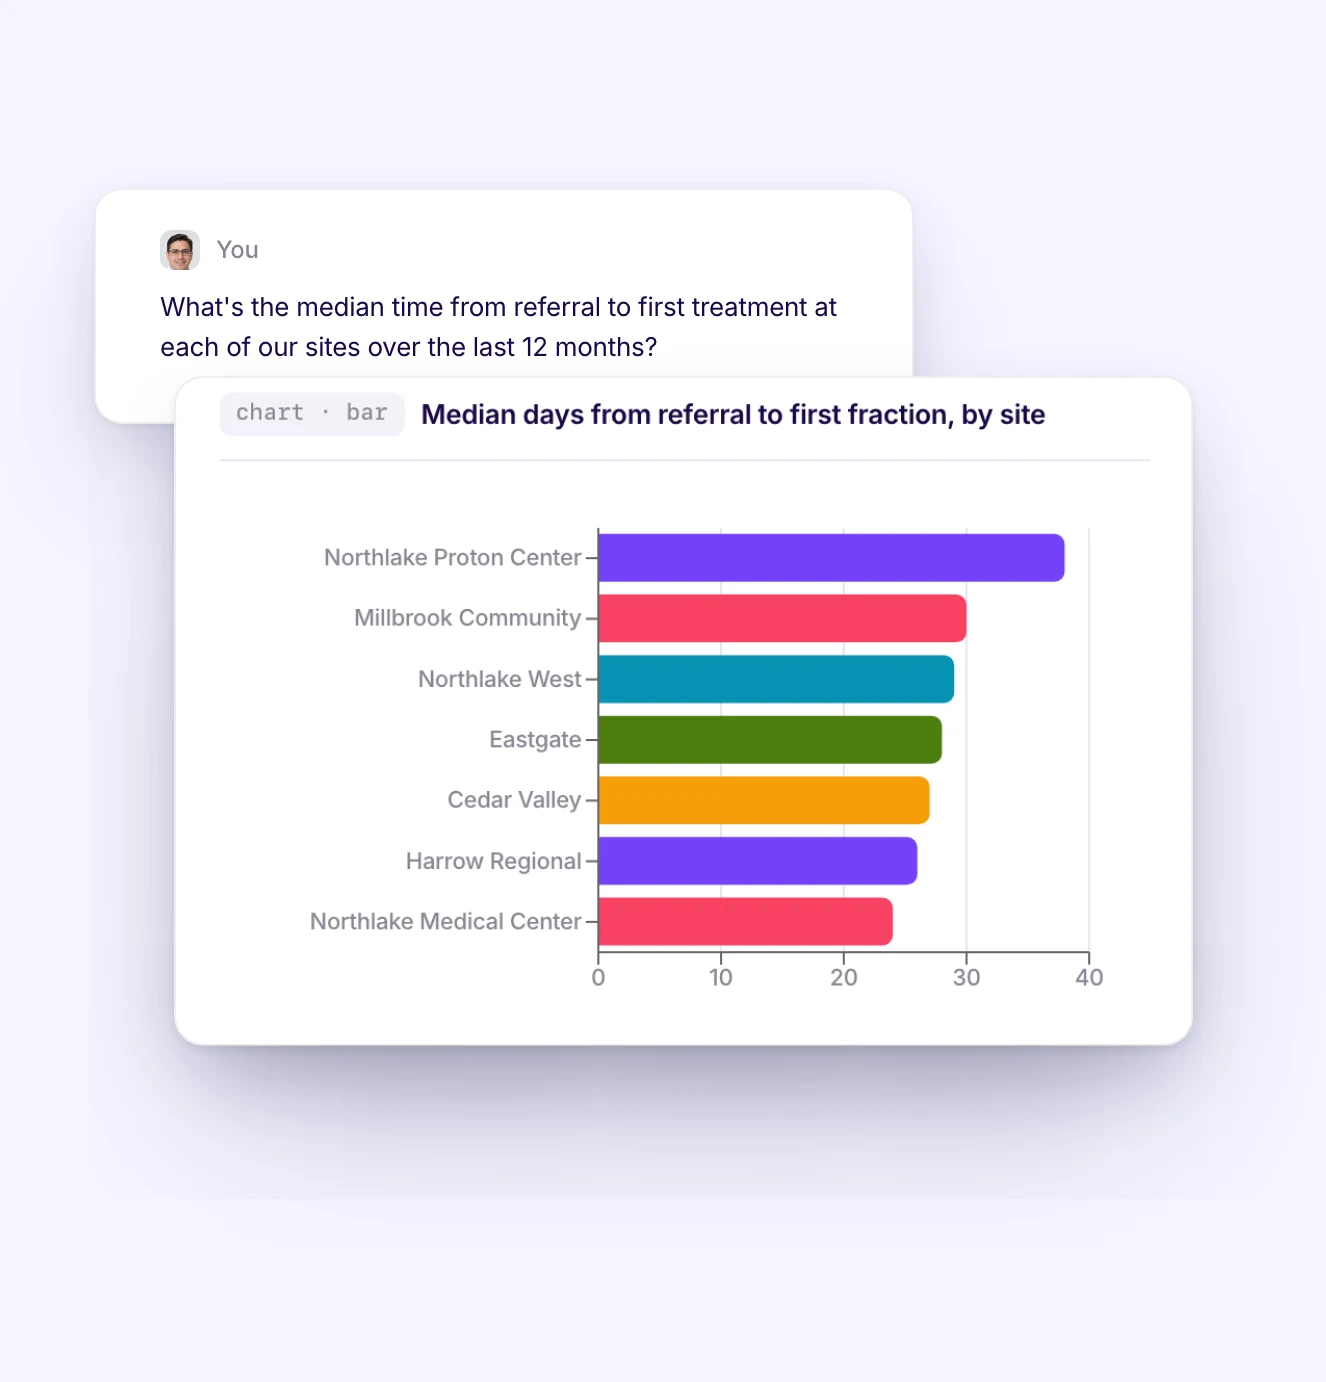
Ask a question. Get the answer and how it was counted.
Studio is the user interface on top of the data foundation. Ask in plain language and get the number, the chart and the evidence: which cohort, which assumptions, which tables. Departments also get the views they work with, such as the melanoma cohort view in oncology.
- 1
Ask in plain English. No SQL, no tickets to IT.
- 2
Every answer shows how it was counted: cohort, assumptions and sources.
- 3
Turn an answer into a dashboard your department can reuse.
FLAME · Healthcare AI Agent
Ask your data a question. Get the answer and the chart.
- 1
Ask in plain language. Medical and business questions answered directly on the CDR, with automatic visualization.
- 2
100% local & data-sovereign. Models can run locally inside the hospital. No data sent to external AI providers. Alternatively, any LLM (OpenAI, Gemini, etc.) can be connected with FLAME.
- 3
Subagents & skills. SQL, FHIR analyst, cohort builder and chart plotting deliver analyses in seconds.
Real-time dashboards
From data to decision in seconds, not days
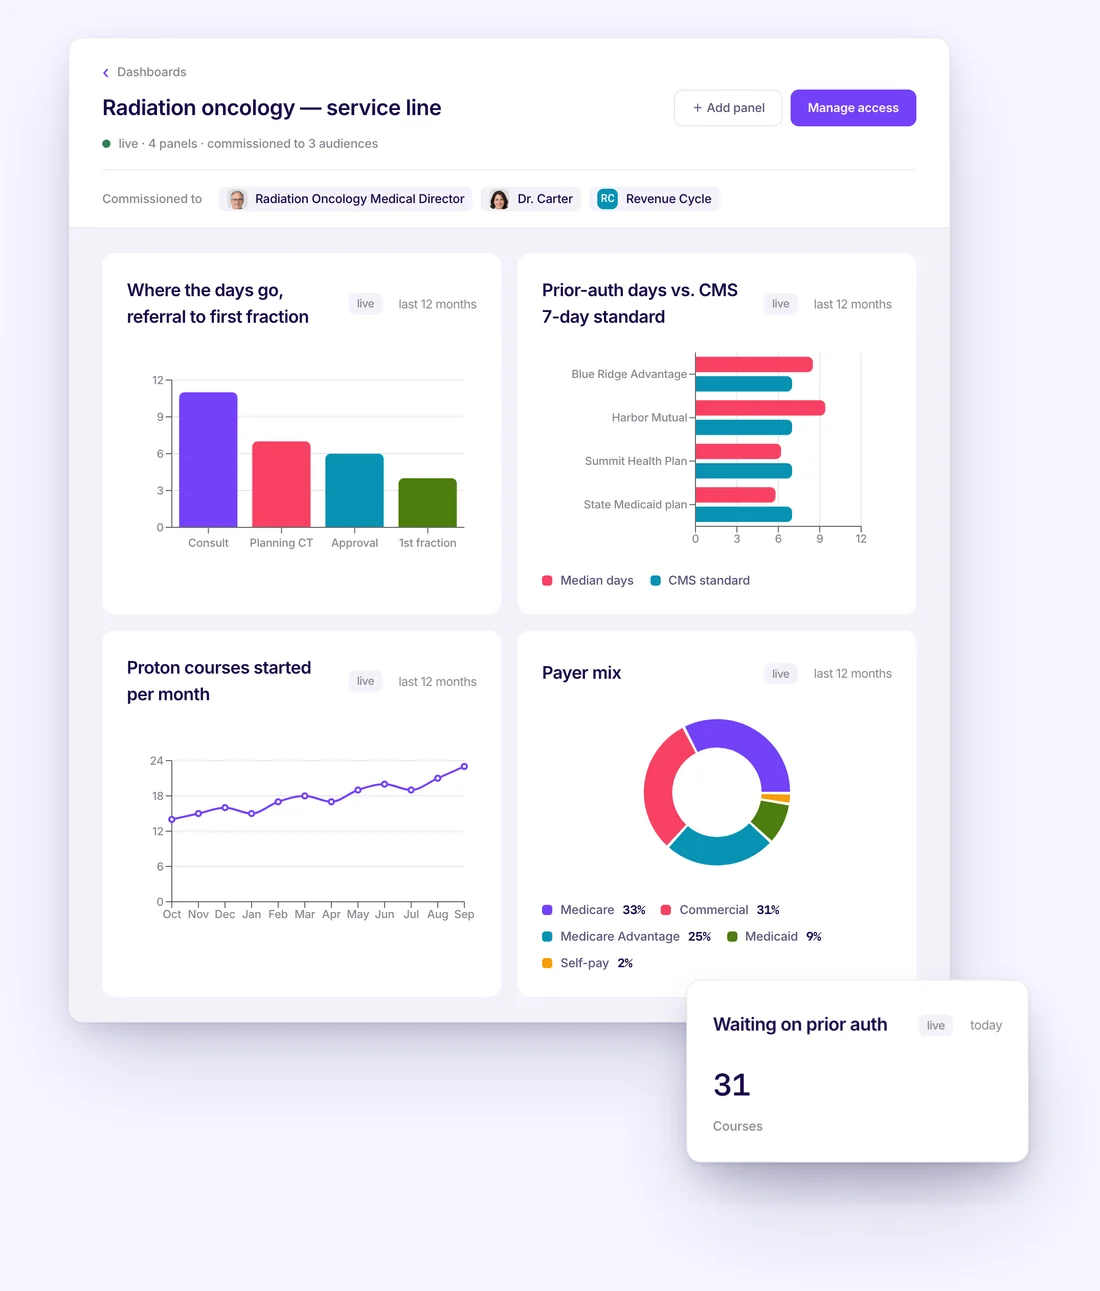
Live dashboards on the same data your staff queries. Every panel can start as a question in Studio, and each dashboard is shared with named audiences.
- 1
From question to dashboard: turn any answer from Studio into a dashboard panel.
- 2
Drag and drop: arrange panels and pick the chart type that fits, no coding needed.
- 3
Automatic reports: turn a dashboard into a report that goes out on a schedule, such as a tumor board package, scanner utilization or ward occupancy.
Patient viewer
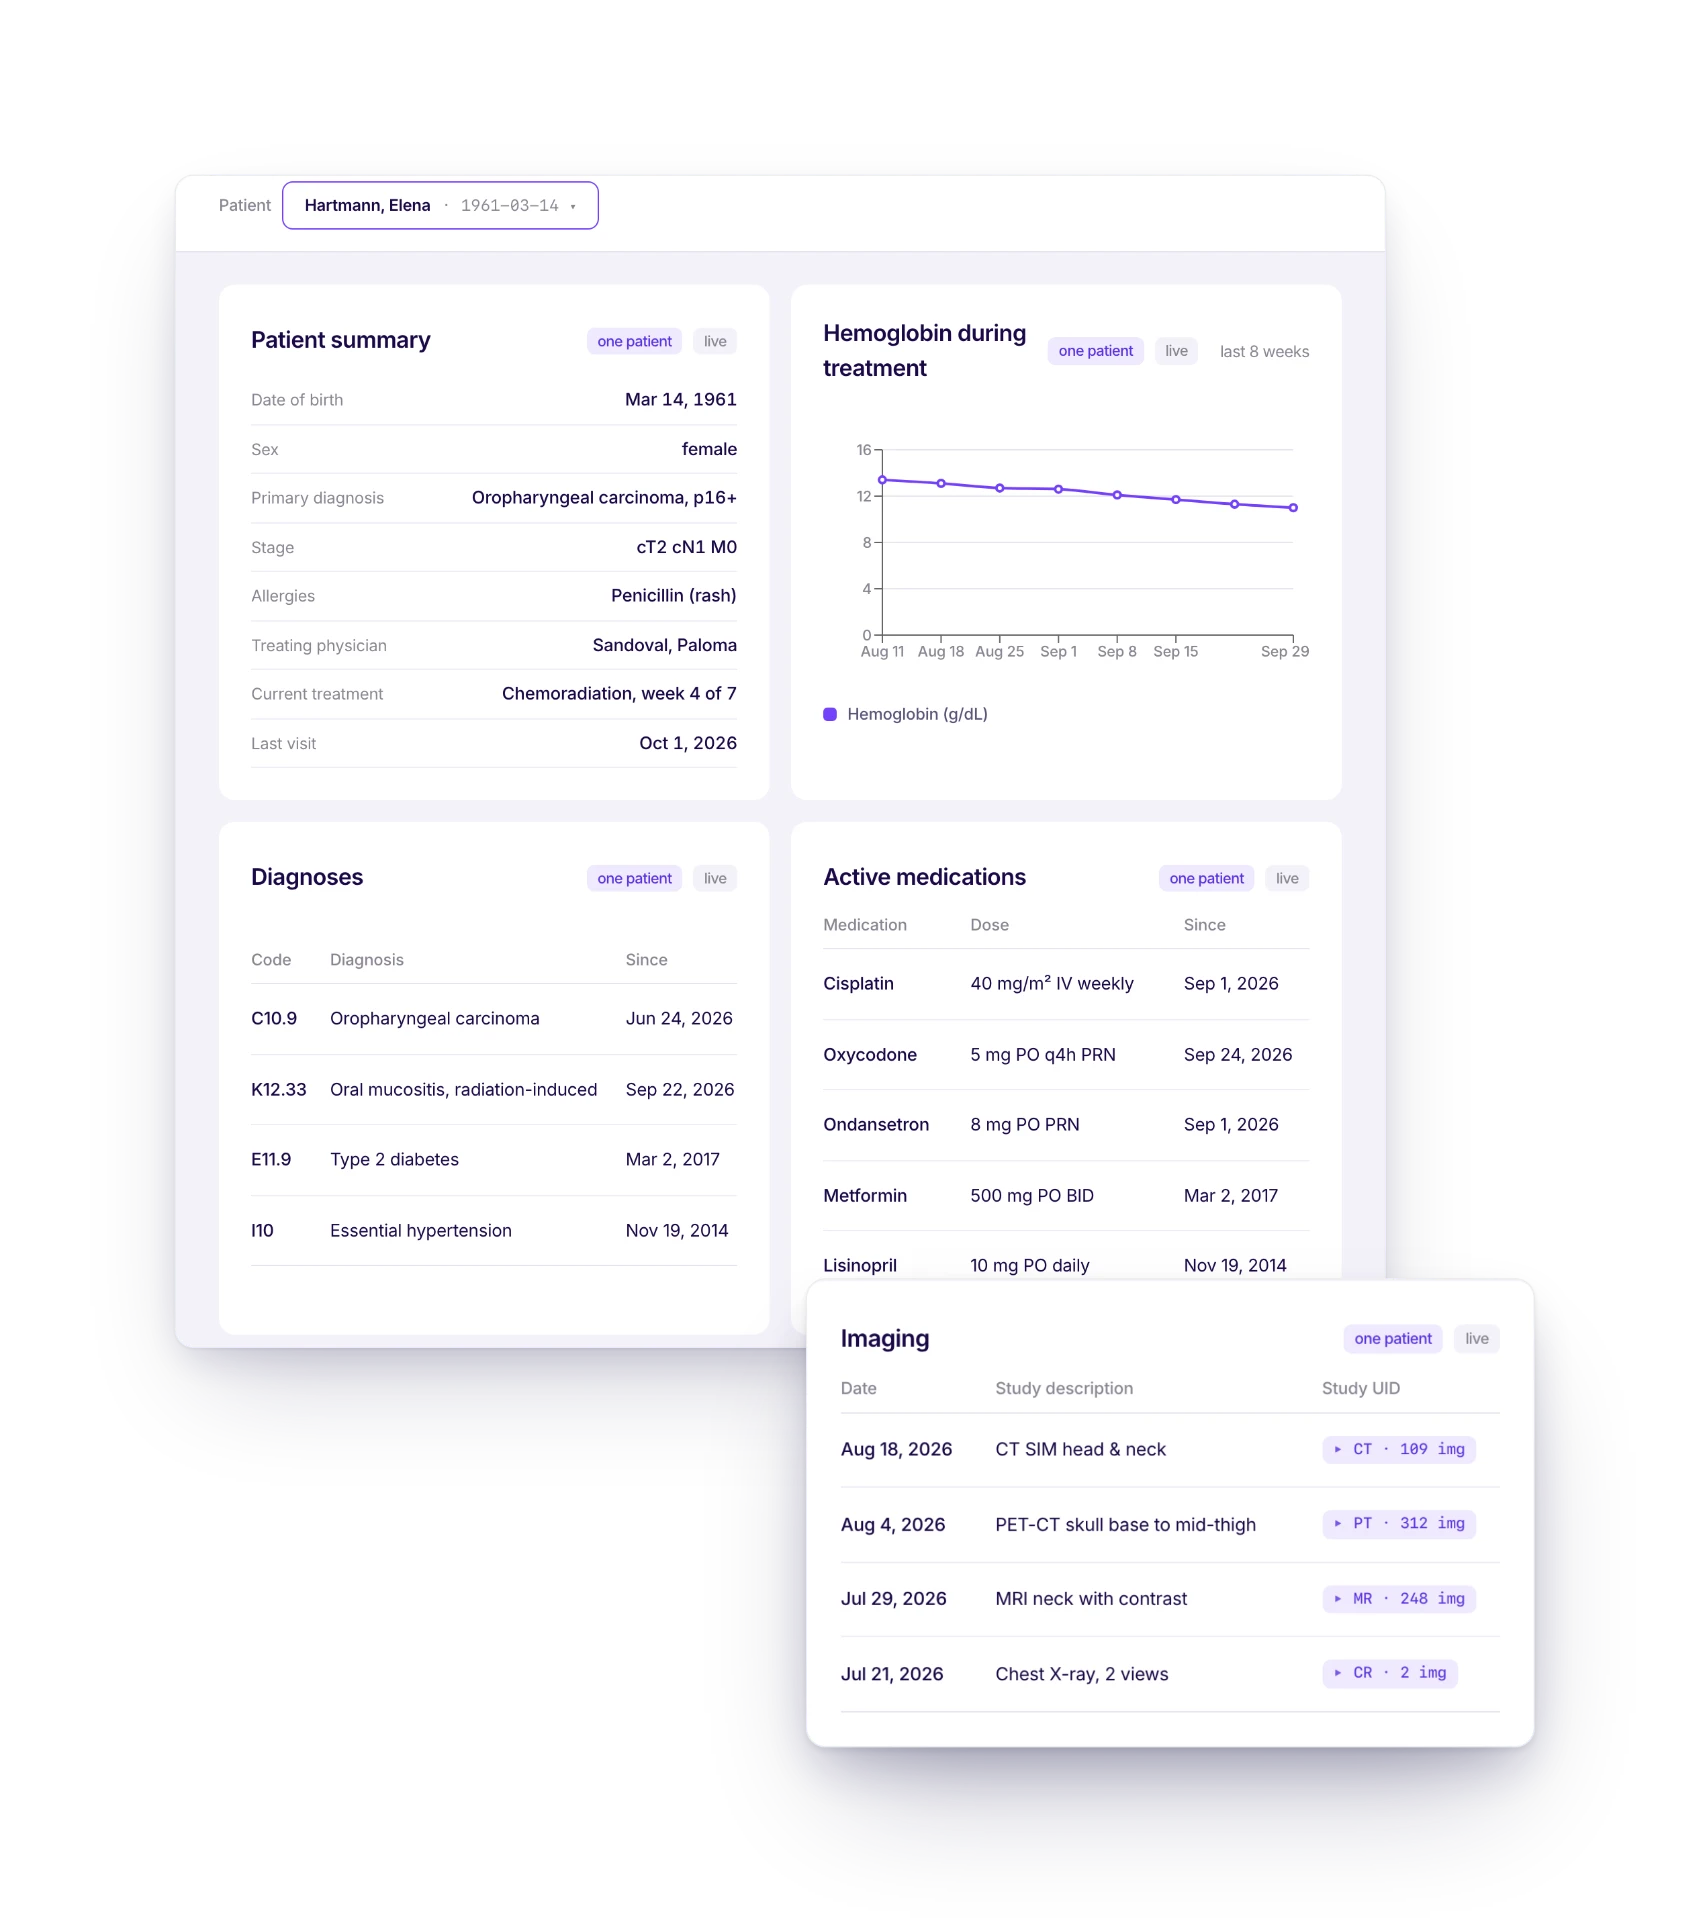
One view. The whole patient.
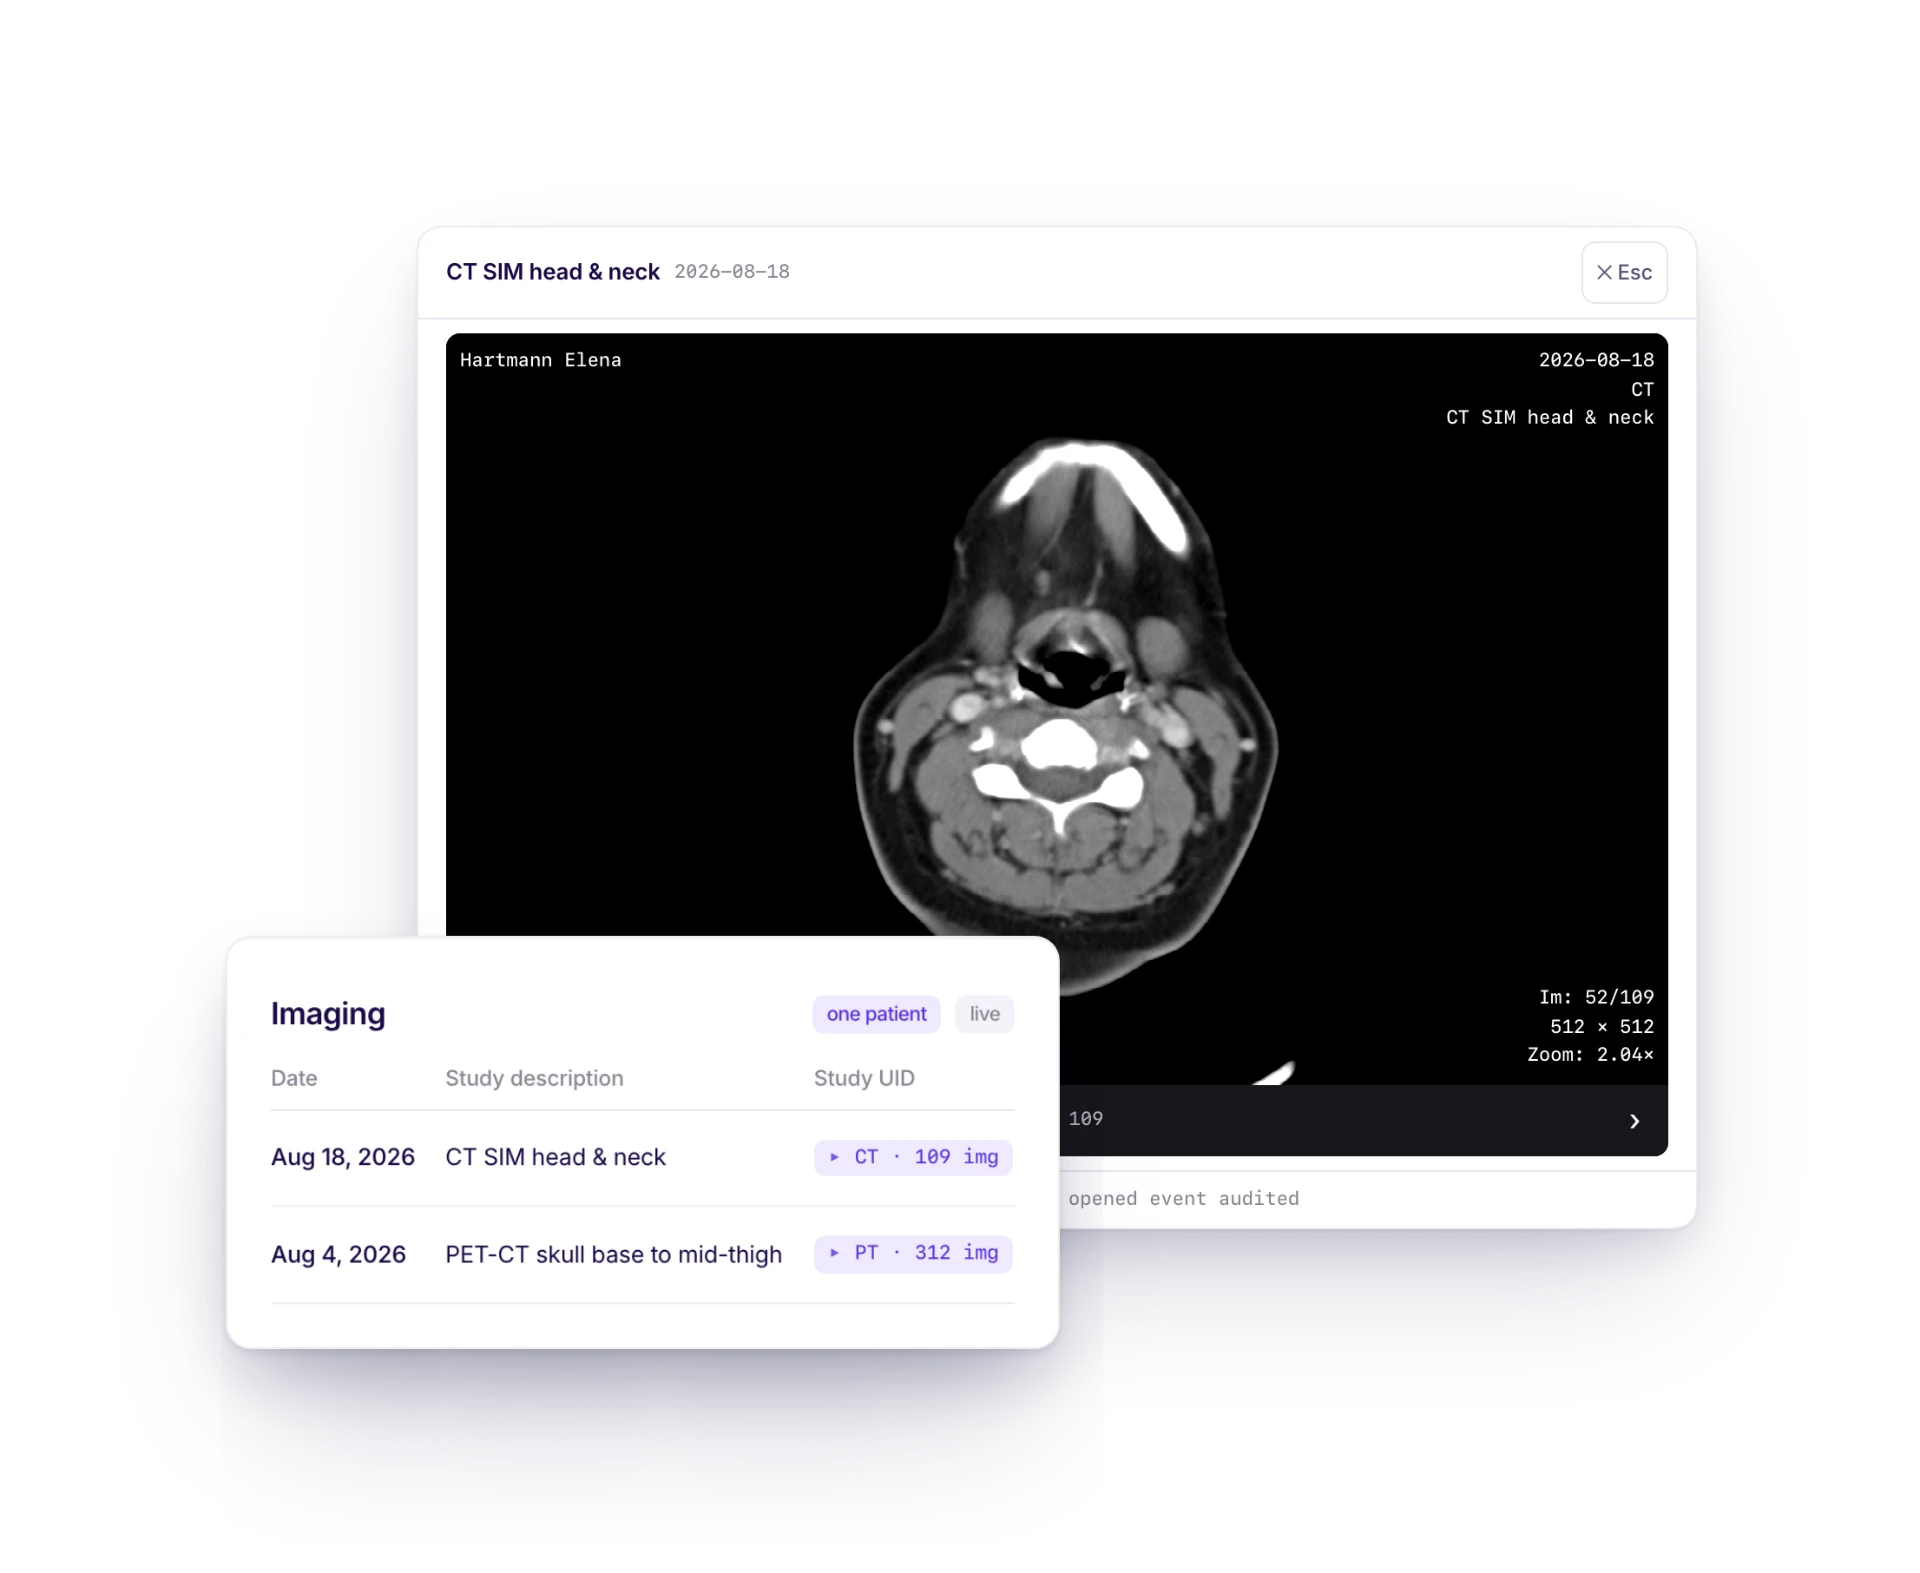
A consolidated patient view for medical staff, relevant in emergencies and for unknown patients. Labs, diagnoses, medications and imaging from all systems in a single view.
Which tool would help your department first?
A workshop on site with your clinicians and IT.